Minitab is the most widely used SPC software in manufacturing. It earned that position. But when a quality engineer says their analysis is "distribution-free," what Minitab offers and what that phrase actually means are two different things.
This isn't a hit piece on Minitab. It's a clarification of terms — because the difference between "offering non-normal options" and "distribution-free analysis" determines whether your capability numbers are correct for your data.
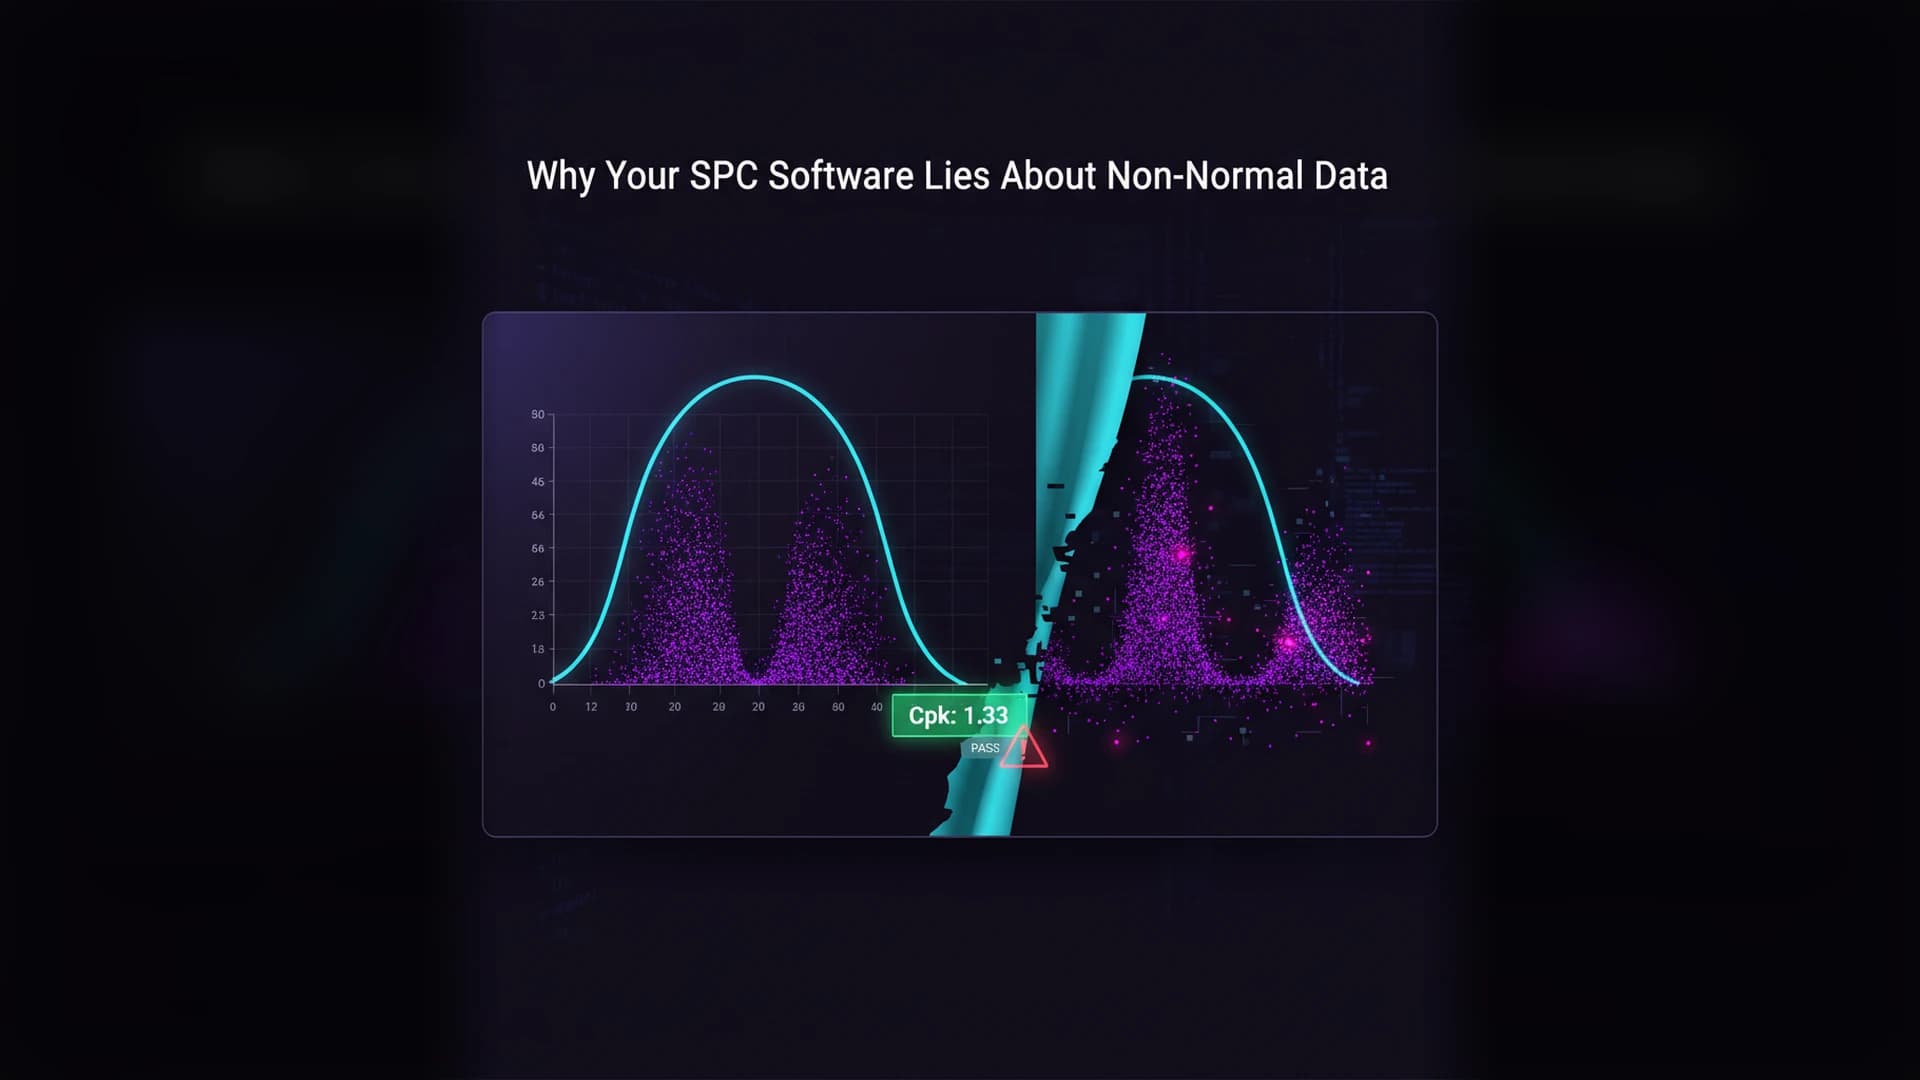
Your SPC software computes Cpk assuming data follows a bell curve — but 60–80% of manufacturing data doesn’t. That silent assumption produces capability numbers that are confidently wrong, costing real money in both directions.
Credit where it's due. Minitab provides a comprehensive traditional SPC suite: control charts, capability analysis, measurement system analysis, DOE, regression. For quality engineers trained in classical methods, the workflow is familiar and well-documented.
Minitab also offers non-normal capability analysis. You can select from a menu of distributions — Weibull, lognormal, exponential, gamma, logistic, and others — fit parameters, run goodness-of-fit tests, and compute capability indices under the selected model.
That's more than most SPC tools offer. The question is whether "select a distribution from a menu" qualifies as distribution-free.
It doesn't.
The Distribution-Fitting Workflow
Here's how non-normal capability analysis works in Minitab and every similar tool:
Collect your measurements
Test for normality (Anderson-Darling, KS, Shapiro-Wilk)
Compute capability using the selected distribution's formula
Steps 3 through 6 replace one assumption (normality) with a different assumption (Weibull, lognormal, etc.). The result is still a parametric model. The result still depends on choosing correctly. The result is still wrong if you choose wrong.
With small samples — say, 15 measurements from a prototype run — multiple distributions pass the goodness-of-fit test. A Weibull, a lognormal, and a gamma all produce acceptable p-values while giving Cpk estimates that range from 0.91 to 1.47. Which model is "right"? The goodness-of-fit test can't tell you. It doesn't have enough data to distinguish them.
This is what Minitab offers for non-normal data: a sophisticated way to guess a different distribution. Better than defaulting to normal. Not the same as distribution-free.
What Distribution-Free Actually Means
Distribution-free means the analysis makes no distributional assumption at all. Not normal. Not Weibull. Not "best-fitting from a menu." None.
The EGDF — Entropic Global Distribution Function — constructs a distribution function directly from your data's information entropy. It doesn't ask "which named distribution does this data resemble?" It asks "what is the actual shape of this data?"
The difference is fundamental:
Minitab's approach: Your data → pick a distribution → estimate parameters → compute capability under that model. The model might be wrong.
Distribution-free approach: Your data → build the distribution function → compute capability from the actual shape. No model to be wrong about.
When the data genuinely follows a named distribution, both approaches produce the same result. EGDF on truly normal data gives the same Cpk as the standard formula. The methods diverge when the data doesn't fit any named distribution — which is most of the time in manufacturing.
Where the Results Diverge
Three scenarios where the distinction matters most:
Skewed data near physical bounds. Machining dimensions near a stop, chemical concentrations approaching zero, surface roughness measurements. In Minitab, you'd try Weibull or lognormal. If neither fits well, you try a Johnson transformation. If that distorts the tails, you try Clements' method. Each step adds a modeling choice that could introduce error.
With EGDF, the bounded, skewed shape is captured directly. No selection step. No transformation. No tail distortion.
Bimodal or multimodal data. Multi-cavity molds, shift-to-shift variation, material lot differences. Named distributions are unimodal. Bimodal data doesn't fit any of them. Minitab's Individual Distribution Identification will tell you no distribution fits well — but won't compute capability from the bimodal shape.
EGDF handles multimodality natively. The distribution function captures whatever shape exists, including multiple peaks.
Mixed or contaminated data. A process that's 95% stable with 5% intermittent disturbance. The disturbance creates heavy tails that inflate fitted σ under any named distribution. In Minitab, you'd either accept the inflated estimate or manually remove outliers (introducing subjective judgment).
Assumption-free statistics with entropy methods handles contamination through the homogeneity testing step — identifying whether the data represents one process or multiple, before computing capability.
The Workflow Comparison
Minitab Capability Workflow
Load data
Run normality test → if it fails:
Open Individual Distribution Identification
Compare 14+ distributions by Anderson-Darling statistic
Time: 5–15 minutes per characteristic. Requires distribution selection expertise. Different analysts may select different distributions from the same data.
EntropyStat Capability Workflow
Upload data
View EGDF distribution and capability indices
Check homogeneity result for hidden subpopulations
Report distribution-free Cpk
Time: under 60 seconds. No distribution selection. Same analyst, same result, every time.
The time difference matters less than the consistency difference. When two analysts can look at the same data in Minitab and select different distributions — getting different Cpk values — the analysis contains a subjective step that shouldn't exist in a measurement process.
When Minitab Is the Right Choice
Minitab wins for:
DOE and regression: Full experimental design suite, response surface methods, factorial designs — capabilities EntropyStat doesn't offer
Measurement system analysis: Gage R&R studies, linearity, stability analysis — deep MSA toolkit
Control chart configuration: Extensive charting options with WECO/Nelson rules, attribute charts, CUSUM, EWMA
Training and documentation: Decades of published examples, textbook alignment, training courses
Minitab is a general-purpose statistical workbench. EntropyStat is a focused distribution analysis and capability tool. They solve different problems.
When Distribution-Free Matters More
EntropyStat is the better choice when:
Your data isn't normal (60–80% of industrial data) and you want correct capability without guessing a distribution
Sample size is small (n < 25) and parametric estimation is unstable
Consistency matters — you need the same analyst-independent result every time
Speed matters — production qualification with dozens of characteristics and no time for per-characteristic distribution selection
PPAP evidence needs to be defensible — "entropy-based distribution-free method" is stronger than "we picked lognormal because it had the lowest AD statistic"
The Term Matters
"Distribution-free" has a specific meaning in statistics. It means the method's validity doesn't depend on the data following any particular distribution. Offering a menu of distributions to choose from is distribution-flexible. It's not distribution-free.
The distinction isn't academic. It determines whether your capability number is an estimate (subject to model selection error) or a measurement (subject only to sampling error). For the decisions that ride on that number — PPAP approvals, process investments, customer scorecards — the difference between estimating and measuring is the difference between guessing and knowing.
Upload your data and see distribution-free capability in under 60 seconds — no distribution menu, no model selection, no guesswork. Compare it to your Minitab results →
Distribution fitting replaces the normality assumption with a different guess. With typical sample sizes, Weibull, lognormal, and gamma all pass goodness-of-fit tests — giving different Cpk values. The distribution fitting step that should fix your analysis becomes its own error source.
What is EGDF? The Entropic Global Distribution Function skips distribution fitting entirely — learning your process shape from the data. Here’s how EGDF and ELDF work, when they outperform traditional methods, and why they produce reliable Cpk from small samples.