When did your process actually shift — and did anyone notice?
That's the question that separates process drift detection from false alarm chasing. Your control chart flags a signal. You investigate. Nothing's wrong. Next week, same thing. Nothing's wrong. The week after that, an actual drift slides past because your team stopped looking.
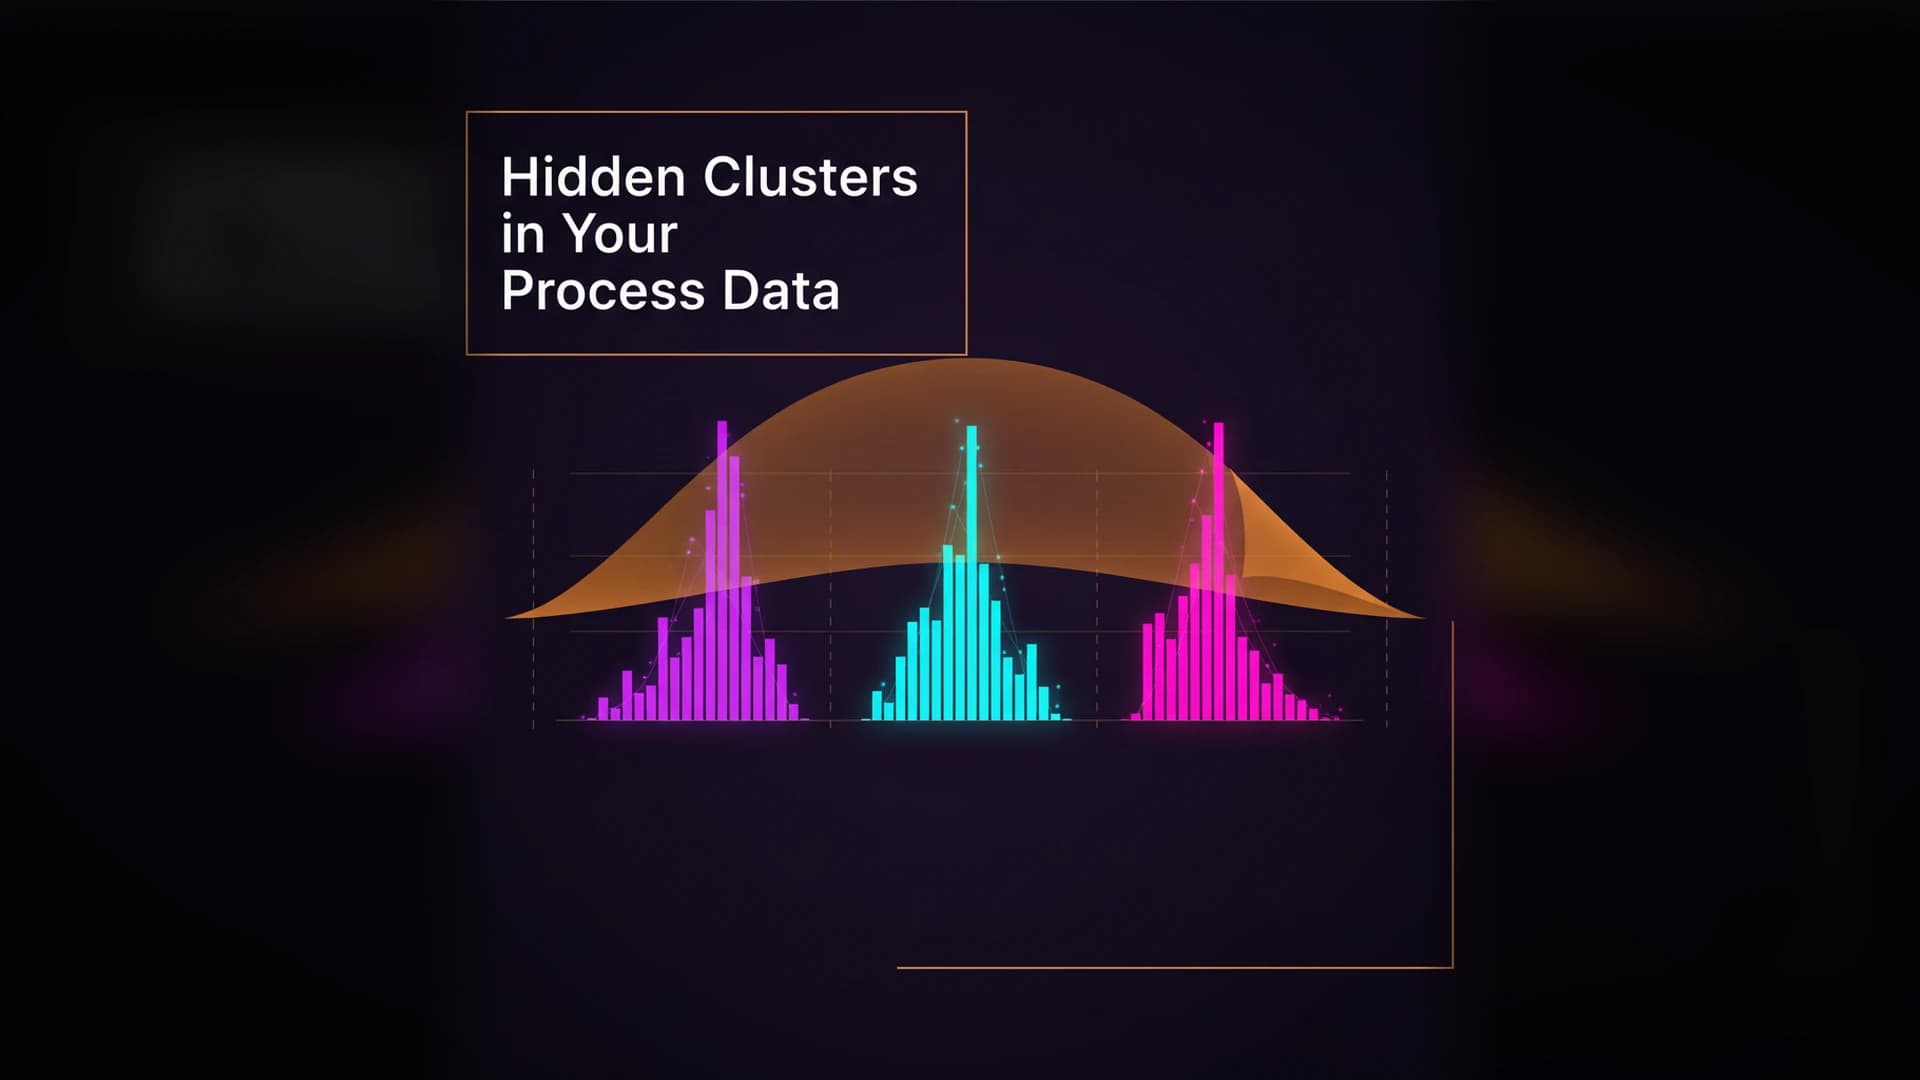
Hidden clusters from multi-cavity molds, shift changes, and material lots produce aggregate Cpk that looks capable — while one subpopulation ships defects. ELDF detects what Cpk can’t see.
This pattern — real drift buried under false signals — is the most expensive failure mode in statistical process control. Not because the charts don't detect drift. Because they detect too much of everything else.
Drift, Shift, and Noise: Three Different Problems
Before detection, definitions. These three phenomena look similar on a control chart but require different responses:
Noise is random variation inherent to any process. It's always present. It has no assignable cause. It doesn't require investigation. A stable process generates noise. That's normal.
A shift is a sudden, persistent change in the process mean or variability. New material lot. Tooling change. Fixture adjustment. It happens at a specific moment and stays. Shifts have assignable causes and require corrective action.
Process drift is a gradual, systematic movement over time. Tool wear. Reagent degradation. Thermal expansion across a production run. Process drift doesn't trigger a sudden alarm — it creeps. By the time a control chart flags it, the process has been out of its optimal range for hours or days.
Traditional SPC treats all three as "out-of-control signals." They aren't. Noise is business as usual. Shifts need investigation. Drift needs trend detection. Applying the same response to all three is how you get alarm fatigue.
Why Shewhart Charts Miss Process Drift
The Shewhart control chart excels at detecting shifts — sudden, large changes in the mean. A point beyond 3σ is hard to miss.
But process drift doesn't produce points beyond 3σ. Process drift produces a sequence of points that are individually within limits but collectively trending. By the time the trend crosses 3σ, the drift has been active for 20, 50, or 100 data points. That's hours of production.
The Nelson rules attempt to catch this: "6 points in a row trending" or "9 points on one side of center." But those rules were designed for normally distributed, independent data. On autocorrelated process data — where consecutive measurements are naturally similar — these run rules fire constantly on stable processes, generating false alarms that mask real trends.
The fundamental problem: Shewhart charts are optimized for large, sudden changes. Manufacturing process drift is small and gradual. The tool and the failure mode don't match.
CUSUM and EWMA: Better but Not Enough
The CUSUM (Cumulative Sum) and EWMA (Exponentially Weighted Moving Average) charts were designed specifically for detecting small, sustained shifts. They accumulate evidence over time, making them sensitive to gradual changes that Shewhart charts miss.
CUSUM tracks the cumulative deviation from target. Even a small consistent drift accumulates into a signal. EWMA applies exponential weights to recent observations, emphasizing trends while smoothing noise.
Both are genuine improvements over Shewhart for drift detection. Both also have limitations:
Parameter sensitivity. CUSUM requires setting a reference value (k) and decision interval (h). EWMA requires choosing a smoothing constant (λ). These parameters trade off between sensitivity and false alarm rate. Choose wrong and you're either missing drift or drowning in false signals. There's no universally correct setting — it depends on how much drift you want to detect, and that's a judgment call made before you see the data.
Normality assumption. Both CUSUM and EWMA derive their control limits from assumed normal distributions. When the data isn't normally distributed — and 60–80% of manufacturing data isn't — the control limits are miscalibrated. Too tight for heavy-tailed data (more false alarms). Too wide for bounded data (missed drift).
No decomposition. CUSUM and EWMA detect that something changed but don't distinguish between types of change. A genuine drift, a shift, and a change in variability can all trigger the same alarm. The investigation still falls to the quality engineer.
The Homogeneity Approach: A Different Question
Traditional process drift detection asks: "has the process mean moved?"
Homogeneity testing asks a more fundamental question: "is this data still from the same process?"
The distinction matters. A mean shift is one type of process change. But manufacturing processes also exhibit changes in variability, changes in distribution shape, and the emergence of subpopulations — all of which indicate drift but don't necessarily show up as a mean shift.
Entropy-based homogeneity testing compares the information content of different data segments. If two time windows have the same entropy structure, the process hasn't changed. If they don't, something shifted — and the method identifies what changed (location, spread, shape, or modality).
This is more powerful than tracking the mean alone because it detects any distributional change, not just location shifts. Tool wear that changes variability without moving the mean. Material changes that alter skewness. The emergence of a second mode from a developing quality issue.
Traditional methods catch mean shifts. Entropy methods catch distributional changes. The second category includes the first and extends well beyond it.
Separating Signal from Noise Without Assumptions
The core advantage of the entropy approach to drift detection is what it doesn't require:
No normality assumption. Control limits aren't derived from Gaussian percentiles. Process stability is assessed from the actual data distribution, whatever shape it has.
No parameter tuning. No CUSUM k-value. No EWMA λ. No Nelson rule selection. The homogeneity test has a statistical basis that doesn't require the user to make sensitivity/specificity tradeoffs before seeing the data.
No independence assumption. Autocorrelated data — the norm in continuous processes — doesn't inflate false alarm rates because the method doesn't assume consecutive measurements are independent.
Automatic decomposition. When non-homogeneity is detected, cluster detection identifies the subpopulations — showing you not just that the process changed but how it changed. Did a second mode emerge? Did the spread increase? Did the mean shift? The answer guides the corrective action.
A Practical Detection Workflow
Combining traditional and entropy-based methods gives you a detection system that's both sensitive and reliable:
Step 1: Establish baseline. Collect reference data from a confirmed stable period. Run homogeneity testing to verify the baseline itself is clean — no hidden clusters or unrecognized shifts.
Step 2: Monitor with context. As new data arrives, compare it to the baseline using homogeneity testing. Supplement with a Shewhart chart for catching large sudden shifts (they're still the best tool for that specific failure mode).
Step 3: Tiered response. Shewhart 3σ violation → immediate check for assignable cause. Homogeneity change detected → investigate the nature of the change (location, spread, shape). Entropy structure stable → no action needed, regardless of Nelson rule triggers.
Step 4: Update baselines. After confirmed process improvements, recalculate baselines using the new stable data. This prevents the "old limits on improved process" problem where charts become blind to new drift because the limits are too wide.
Step 5: Track detection rate. If more than 10% of investigations find no assignable cause, the detection system is too sensitive — not the operators too careless. Adjust rules or parameters for traditional charts. Entropy-based process monitoring self-calibrates.
The Goal Isn't Fewer Charts. It's Better Signals.
Process drift detection doesn't need more rules, more charts, or more sophisticated alarm logic. It needs a clear answer to one question: has the process changed?
When the answer is yes, you need to know how. When the answer is no, you need to trust it and stop investigating noise. The space between those two states — where most quality teams spend their time — is where false alarms live and real drift hides.
Entropy-based methods shrink that space. Not by being less sensitive, but by being sensitive to the right things.
See how entropy-based homogeneity testing separates real process drift from statistical noise — no chart configuration, no parameter tuning. Analyze your data free →
Alarm fatigue isn’t a people problem — it’s a chart problem. These five control chart mistakes drive false alarm rates through the roof and teach operators to ignore real signals.